We recently analyzed 2019 housing data for all of Salt Lake County to gain insight as to what the housing market looked like by the numbers last year. Here is what we’ve found.
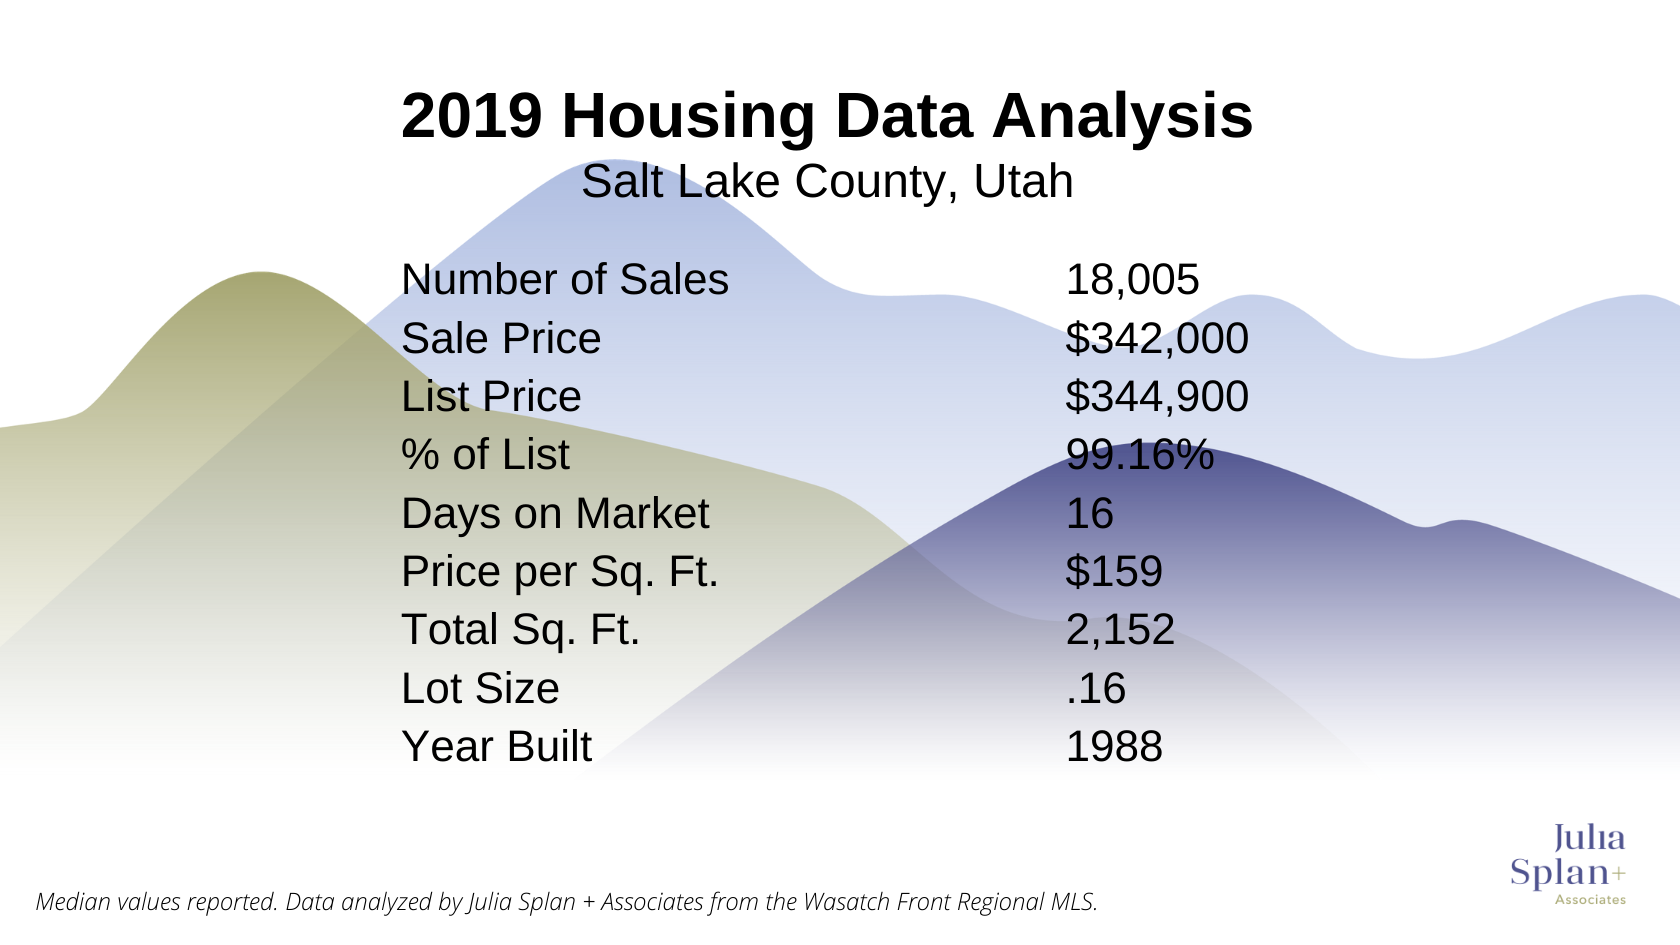
Salt Lake County Median Sales Price was $342,000 for 2019
There were 18,005 residential sales in Salt Lake County for 2019. Residential sales include single family homes, townhomes, twinhomes, and condos. The median sales price was $342,000, selling at 99.16% of list price. When a home was listed for sale, the median time to receive an offer was 16 days. The median price per square foot was $159 and median total square feet of the property was 2,152. Lot size and year built came in at .16 and 1988, respectively.
Salt Lake County is estimated to have over 1.1M residents and spans over 800 square miles, so we took our analysis a little further and looked at the same metrics for key cities within the county and summarized our findings on the table below.
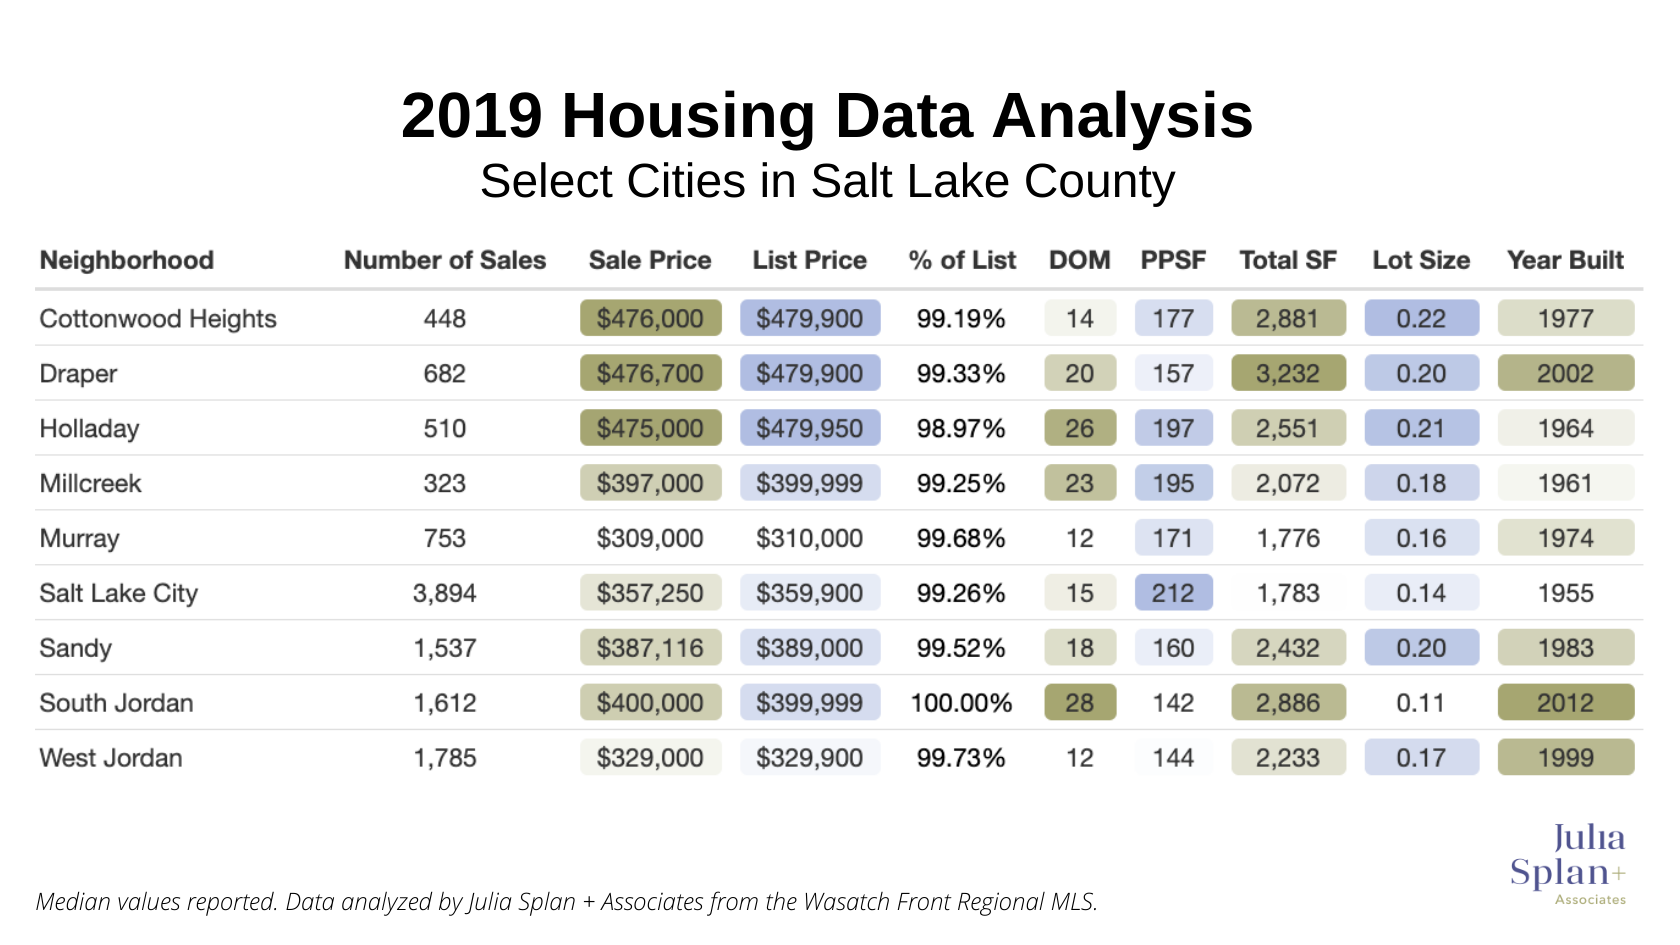
In 2019, Draper, Cottonwood Heights and Holladay had the highest median sales price at $476,700, $476,000 and $475,000, respectively. Overall Draper has larger, newer homes with a median total square foot of 3,232 and 2002 median year built. But Holladay had the higher median price per square foot at $197.
Sandy and South Jordan had a similar amount of sales and median sales price, but the homes in South Jordan are generally newer than those in Sandy with a larger footprint, but smaller lot. The homes in Sandy have a median year built of 1983, and as such, have a smaller footprint but often larger lot.
Salt Lake City has the overwhelming majority of sales for 2019, with 3,894 units sold. It is a general trend that price per square feet goes down as the price of the home goes up, and since the median total square foot of homes in Salt Lake City is on the lower side at 1,783 its median price per square feet is the highest at $212.
We Also Looked at the Home Price Distribution
We also plotted the data to see how home prices were distributed for the same cities in Salt Lake County. For ease of viewing we focussed on home sales less than $1,000,000, as these accounted for the vast majority of sales in 2019.
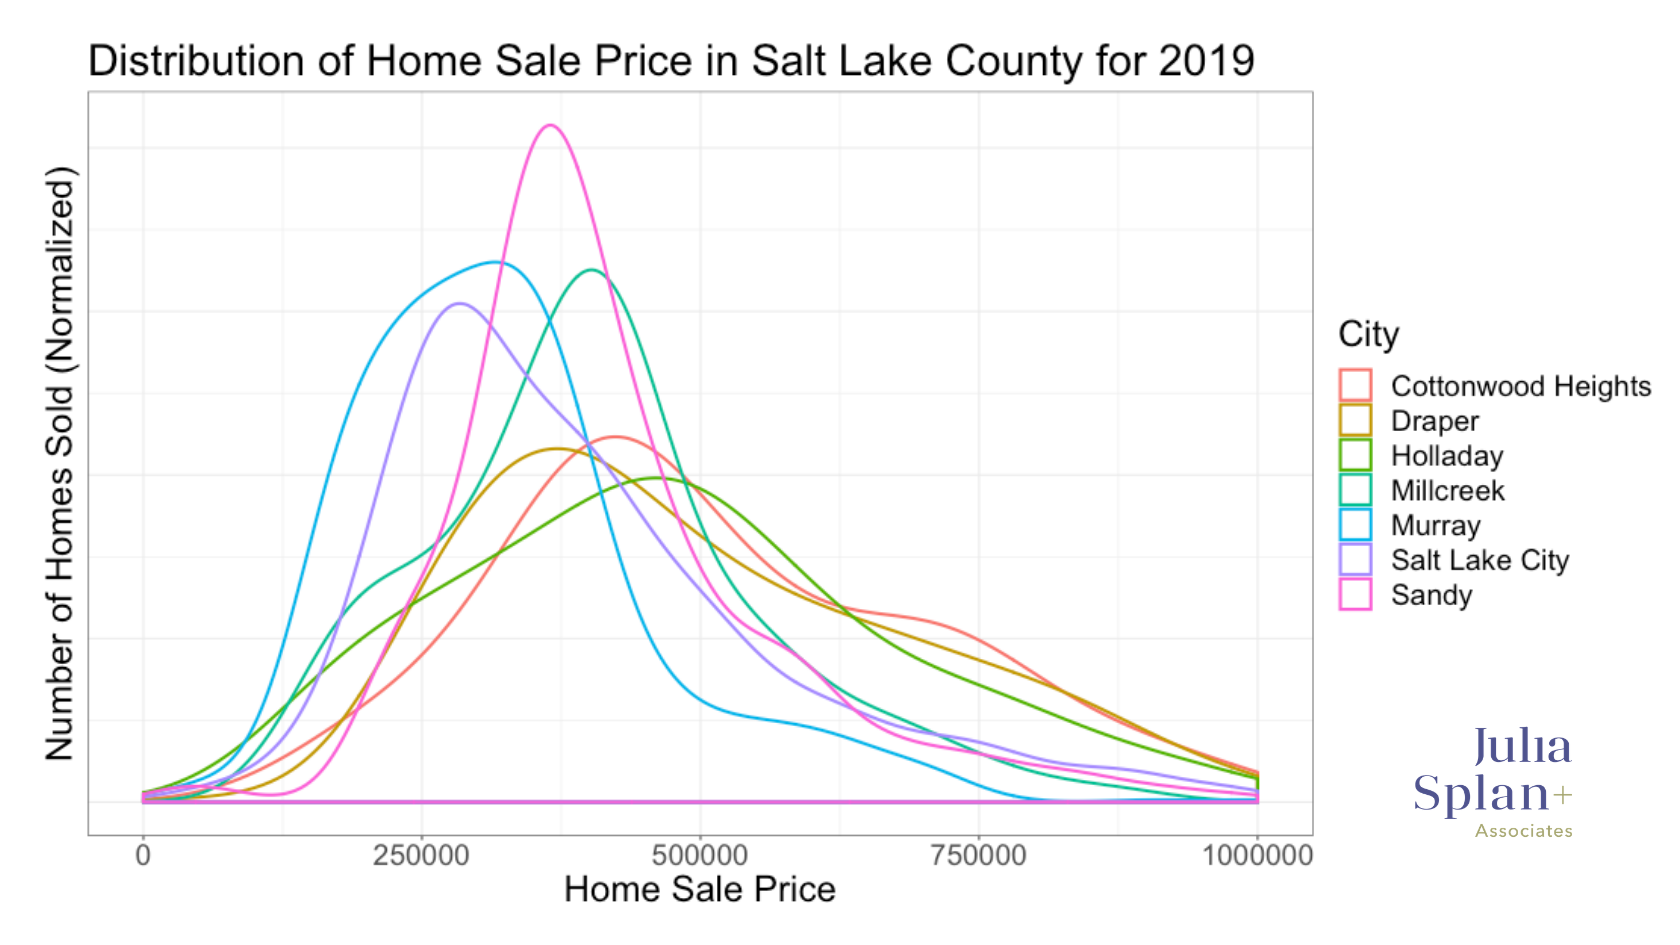
On the graph above, we’ve plotted the number of homes sold at a given selling price to see what the distribution of sale prices in a specific city looks like. In other words, we wondered if different cities were more homogenous or heterogenous in terms of its housing costs.
The city of Sandy, Utah shows the tightest distribution of home sale prices, i.e. the prices there are most similar.
On the other hand, Holladay, Draper and Cottonwood Heights show more broad distributions of home sale prices. This can be seen in the above graph by looking at the shapes of the curves for these cities and noticing that they are all more flattened and have a longer tail towards high priced homes.
Salt Lake City, Utah is diverse, large, and spans all the way across the valley. As such the housing options are also incredibly diverse, from low price starter homes all the way to multi million dollar estates. This isn’t particularly reflected in the above graph, but it is important to remember that these distributions are derived from the volume of homes sold in 2019. In general, lower priced homes sell at a greater velocity relative to high priced homes, thus creating potential bias towards lower prices in the distributions above. Salt Lake City had the highest volume of homes sold by far relative to the other cities mentioned, and many of these were at lower price points.
In the future, we plan to look at data by localized neighborhoods within Salt Lake City such as the Avenues, Sugar House, Downtown, etc. to help people living in those areas get a more precise picture of the sales distribution in their neighborhood.
If you’d like to know how the data stacks up for your unique neighborhood, and how it relates to your home, give us a call.
Home statistics and housing data analysis provides insight into patterns or past trends in our great state, but they are also generally considered lagging indicators and not necessarily reflective of the current or future real estate market in Salt Lake City. So while important to know, it is our counsel to look at the data in connection with true expertise about the current state of the market in your specific neighborhood before reaching a conclusion about the true state of the market. We would be happy to share our expertise with you, so reach out if you’re curious!
The data used for these analyses was obtained by pulling all residential real estate transactions that closed in 2019 in Salt Lake County from the Wasatch Front Regional MLS.
Become a Utah Insider Today
Stay up to date with everything happening in the Utah market.