
Some Small Signs Our Supercharged Market Might Be Starting To Adjust?
While house prices across both Salt Lake City and Park City continue to climb as high as our hot summer climate, there are some subtle signs that our ever-competitive real estate market may be ever-so-slightly changing.
Although it’s far too early to be drawing any major conclusions — especially given the rate at which house prices are still rising — there are a few very interesting trends we gathered over the past month and the quarter as a whole. Read more about what’s caught our eye in the market reports for both Salt Lake City and Park City below.
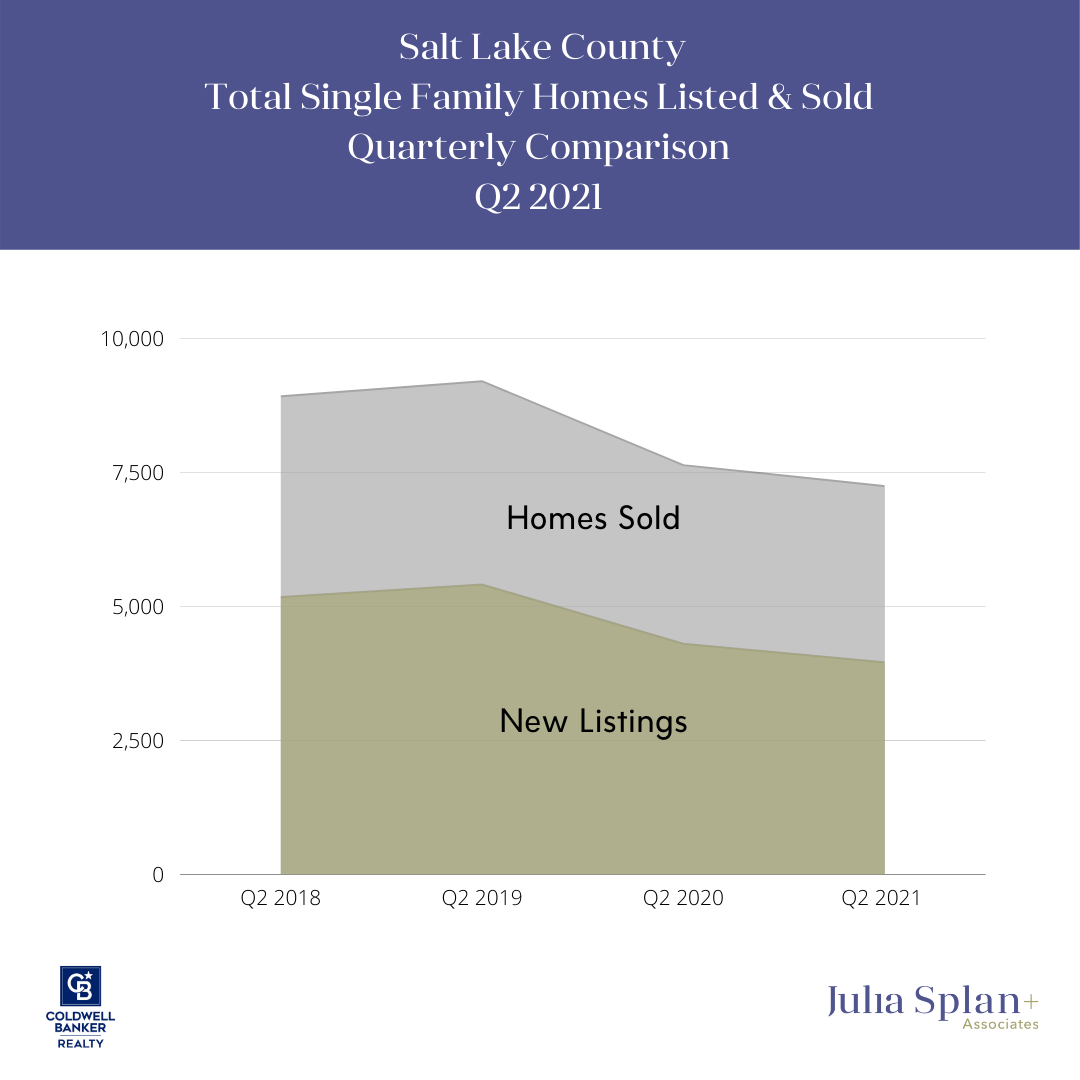
Salt Lake County – Q2 2021 Market Stats for Single Family Homes
The most notable trend, of course, is the large increase in median sales price. It jumped up 30% in Q2 2021 to $535,000, up from $410,000 in 2020. The total number of single family homes sold remained fairly consistent, however down slightly, with 3,331 units in Q2 2020, and 3,288 units in Q2 2021.
Total single family home listings in Salt Lake county decreased 8% to 3,958 units in Q2 2021, although the drop was not nearly as significant as the previous year (listings were down 20% Q2 2020 v. Q2 2019).
In Q2 2021 83% of the listings were sold, this is up 7% from last summer. And as a reference point, back in Q2 2018, just 72% of the new listings were sold. It was a hot, busy market this last quarter.
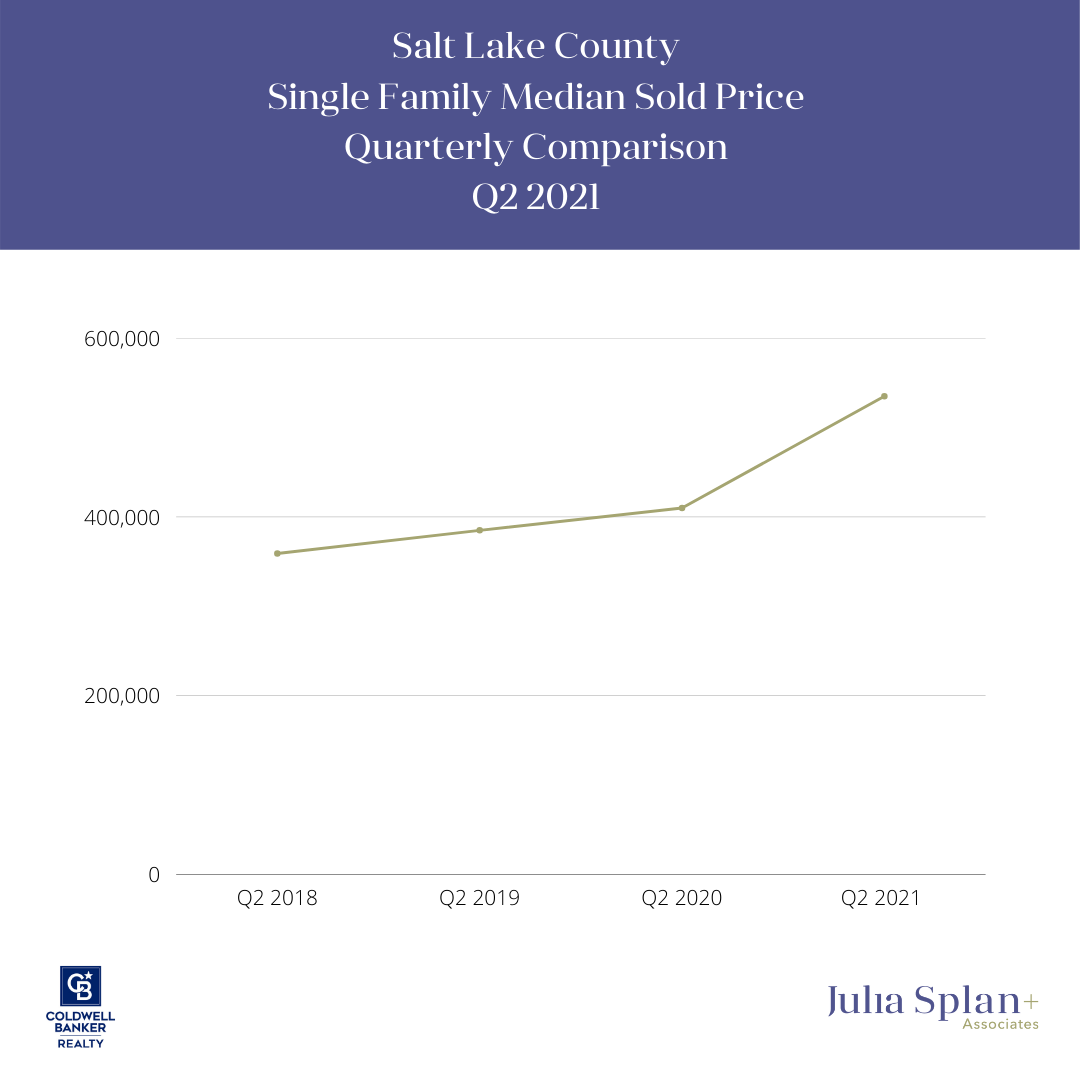
The median sold price for single family homes in Salt Lake county is up 25% from $413,016 to $520,000 2021 YTD. The total number of new listings and total sales are down slightly from last year, but the percentage of homes sold remains high and the median days on market is continues to be stuck at 5 (which is essentially 0).
Summit County – Q2 2021 Market Stats for Single Family Homes
The median sales price for single family homes in Summit county and Park City shot up 47% to $1,800,000 in Q2 2021. It was $1,221,500 in Q2 2020. Summit county has not seen the same limitations in new listings as Salt Lake county, and is largely holding steady around 300. Sales, however, are up significantly with 199 units sold in Q2 2021. This is a 70% increase from Q2 2020.
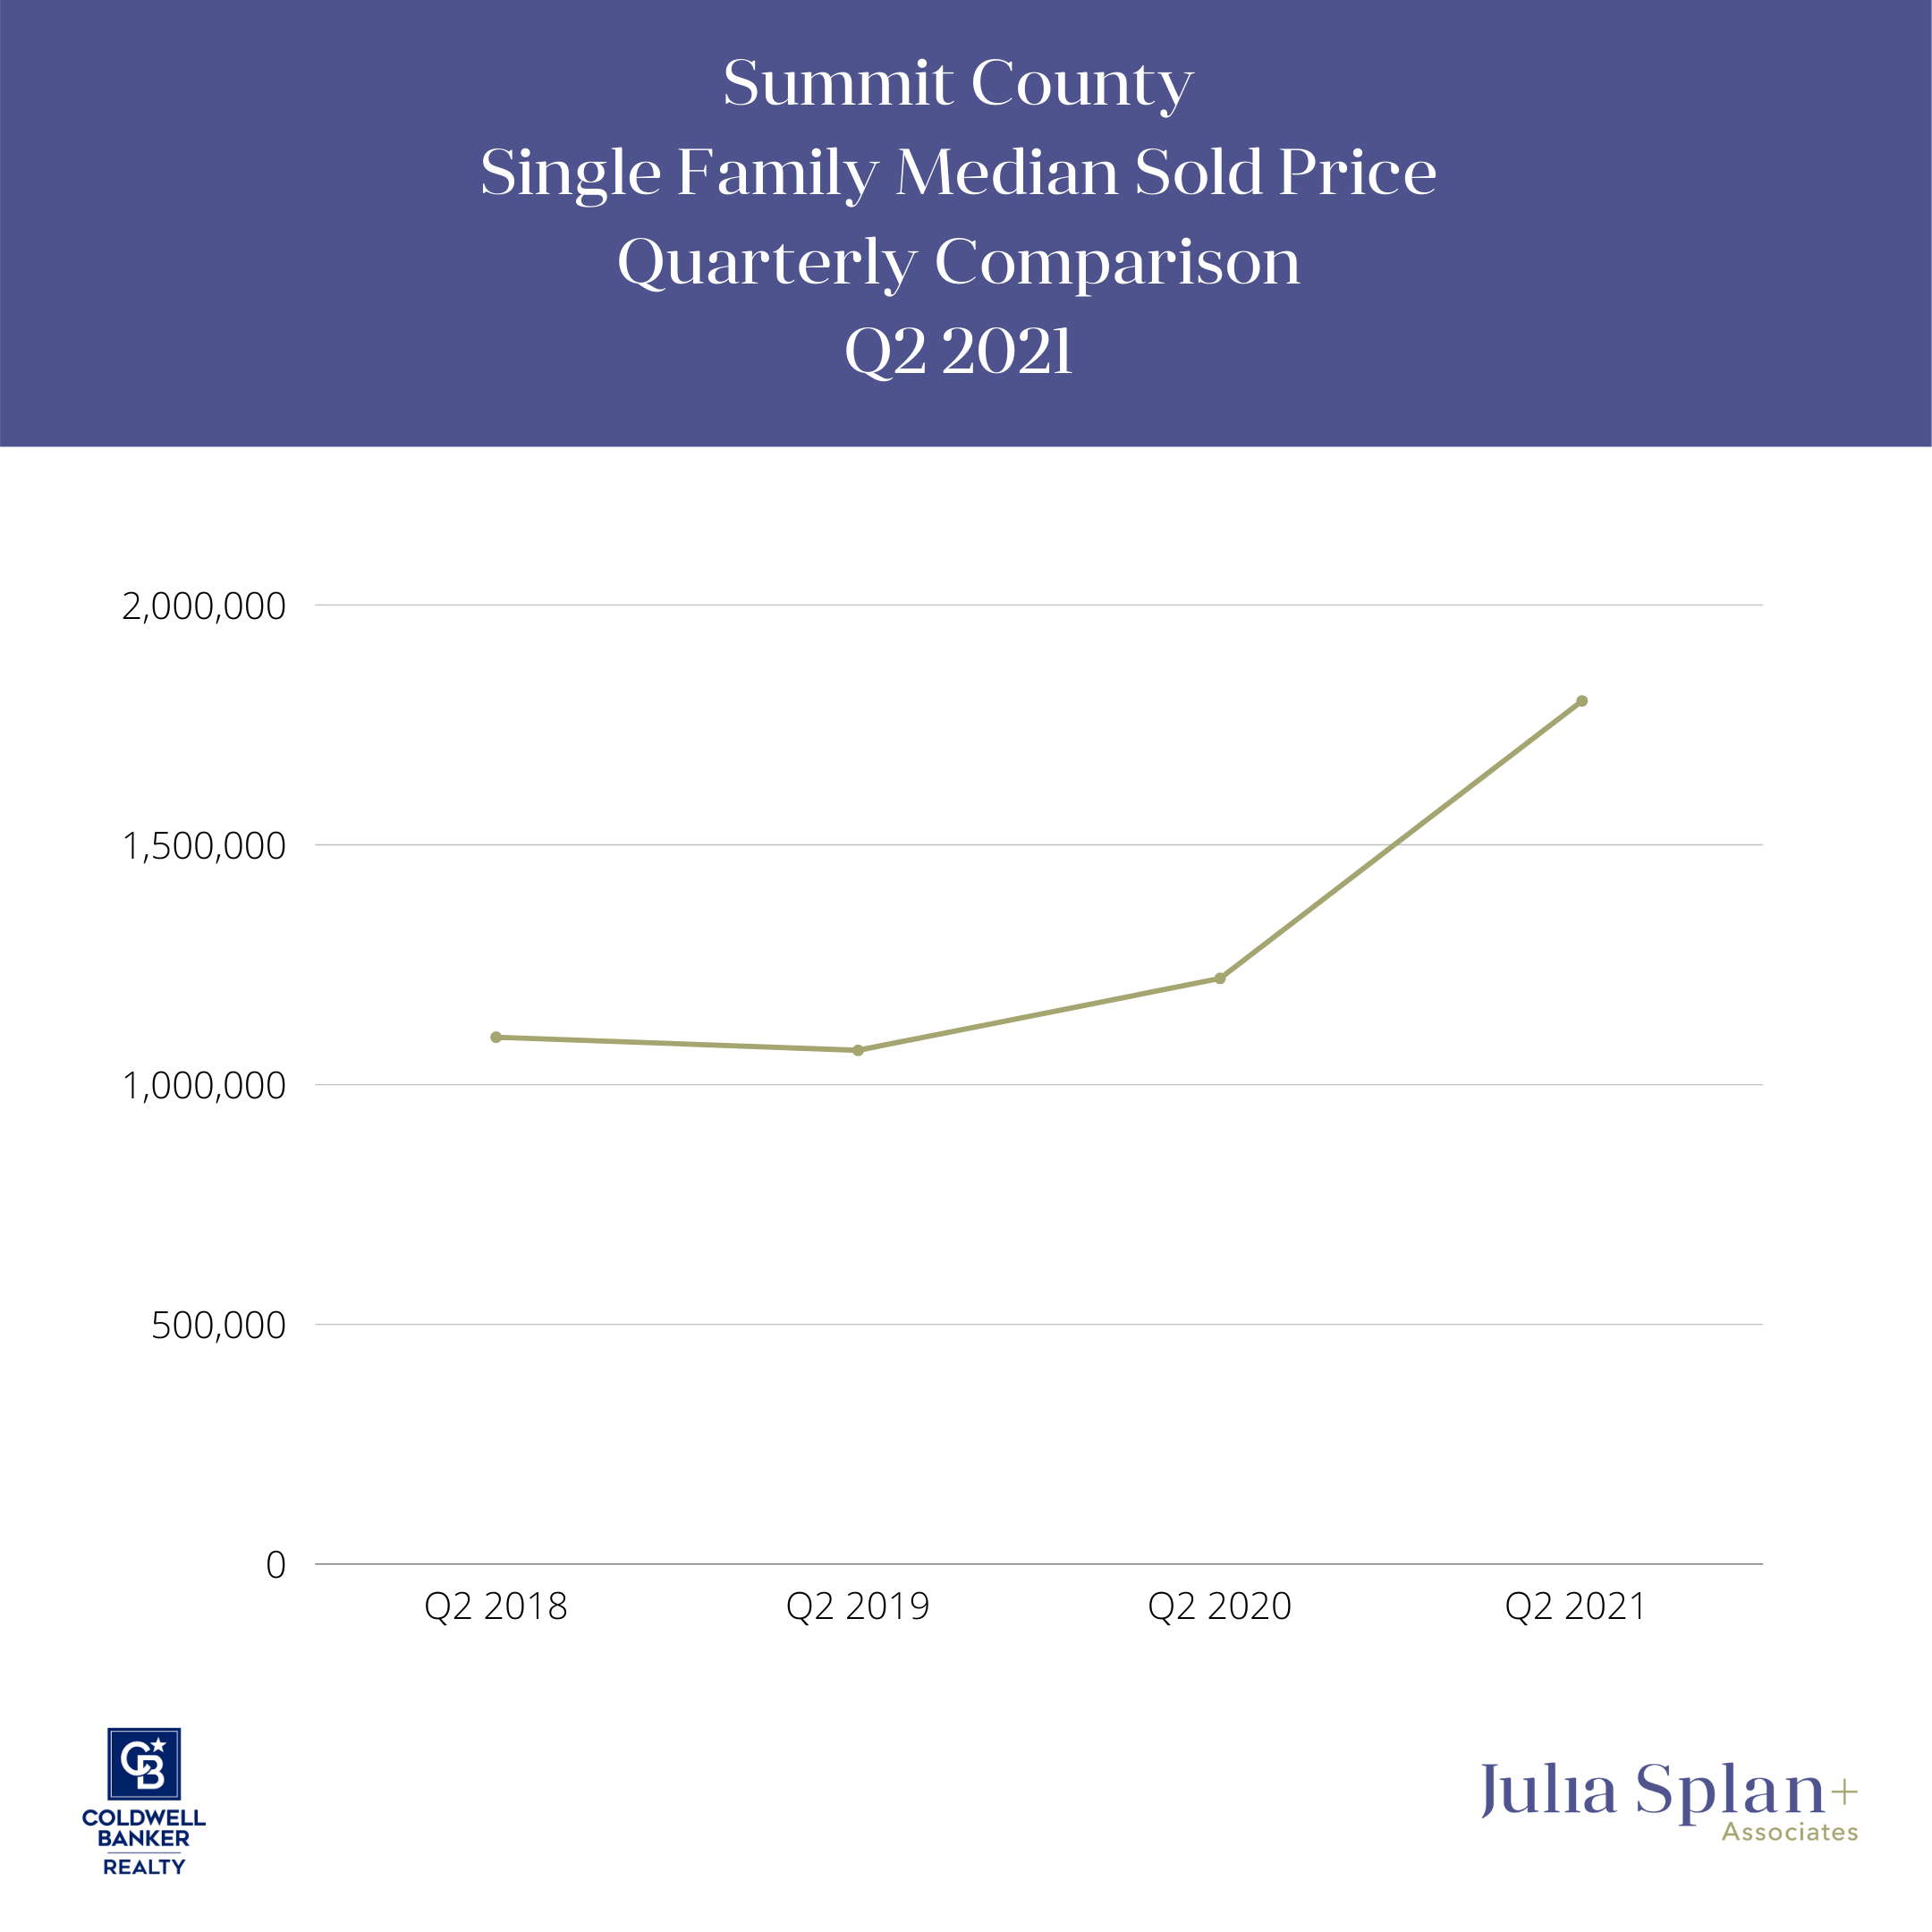

Year to date comparison for Summit county follows the same trends. The median sold price for single family homes in Summit county is up 54% to $1,750,000. It was $1,135,000 at this time last year. The total number of new listings are down slightly, but the total sales have significantly increased, up 29% in 2021 to 477 YTD.
Salt Lake City – Year/Year Market Stats for Single Family Homes, June 2021
- At 1199 units sold this past month, we saw a decrease of 13% from June 2020
- Median sales prices increased compared to last year, up 31% to $551,000 in 2021
- The median sold price per square foot increased 32% from last year to $224 in 2021
- Homes spent a median of 5 days on market (same as last four months) — down from 16 days in June 2020
Park City – Year/Year Market Stats for Single Family Homes, June 2021
- At 63 units sold this month, we saw an increase of 42% from June 2020
- Median sales prices increased compared to last year, up 55% to $2,334,000 in 2021
- The median price per square foot increased by 68% to $626 this year
- Homes spent a median of 5 days on market — down from 22 in June 2020
The Takeaways
Just like last month — and almost every month in recent memory — house prices across Salt Lake City and Park City are still steadily climbing. Add to that the extraordinarily low number of days on market and the still sub-par numbers of active inventory and you’ve got a real estate market that’s about as hot as the Utah desert in July.
But what’s the catch that’s caught our attention?
Although the number of sales is still increasing, they aren’t increasing at the same rate as they were before. And, while the levels of active inventory are still limited, they are starting to increase (slightly).
One possibility is that we’re starting to show evidence of reaching an inflection point. Insiders believe there’s a chance we might soon see the limit of how high sales prices will go, however, nothing is for certain. One thing we do know is that July is traditionally a less active month. We’ll wait to see if any major conclusions can be drawn, but for now, we’re keeping a close eye on the stats.
All data is sourced from utahrealestate.com, Domus Analytics, and both the Salt Lake Board of Realtors and the Park City Board of Realtors.
Become a Utah Insider Today
Stay up to date with everything happening in the Utah market.